Innovative Solutions for Transportation Problems
Traffic Micro-Simulation | Digital Twin | Virtual Reality
Mission
Improve Capacity

Reduce Travel Time

Improve Safety

Reduce Emission
Applications
Virtual Reality Traffic Co-Simulation
Co-Simulation of Vissim and Unity
Co-Simulation of SUMO and Unity
Co-Simulation of Aimsun and Unity

Active Transportation and MicroMobility
Pedestrian level of service analysis
Bicycle level of service analysis
E-Scooter level of service

Intelligent Transportation Systems
Roadside animal detection system
Collision warning systems
Automated and connected vehicles

3D Interactive Visualization
Visualization Interface
360 Degree Videos
Digital Twin

Freight Transportation
Intelligent lane utilization
Long combination vehicle
Truck Signal Priority

Public Health
Response time analysis
Preemptive reallocation of fire services
Capacity analysis
Virtual Reality Traffic Co-Simulation
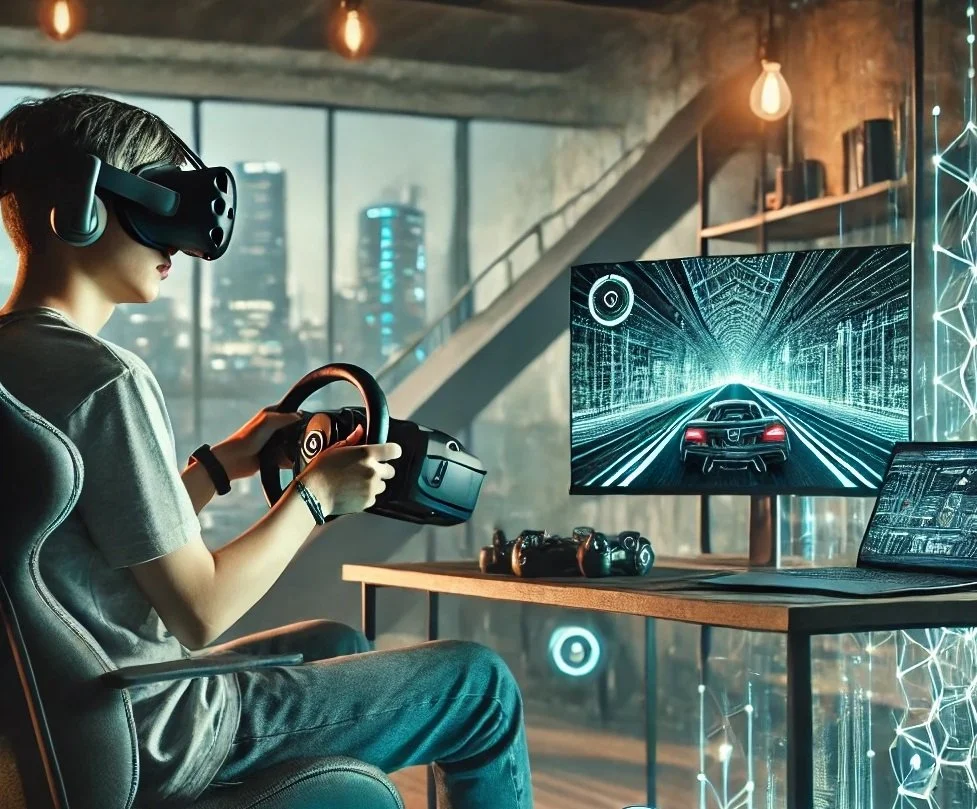
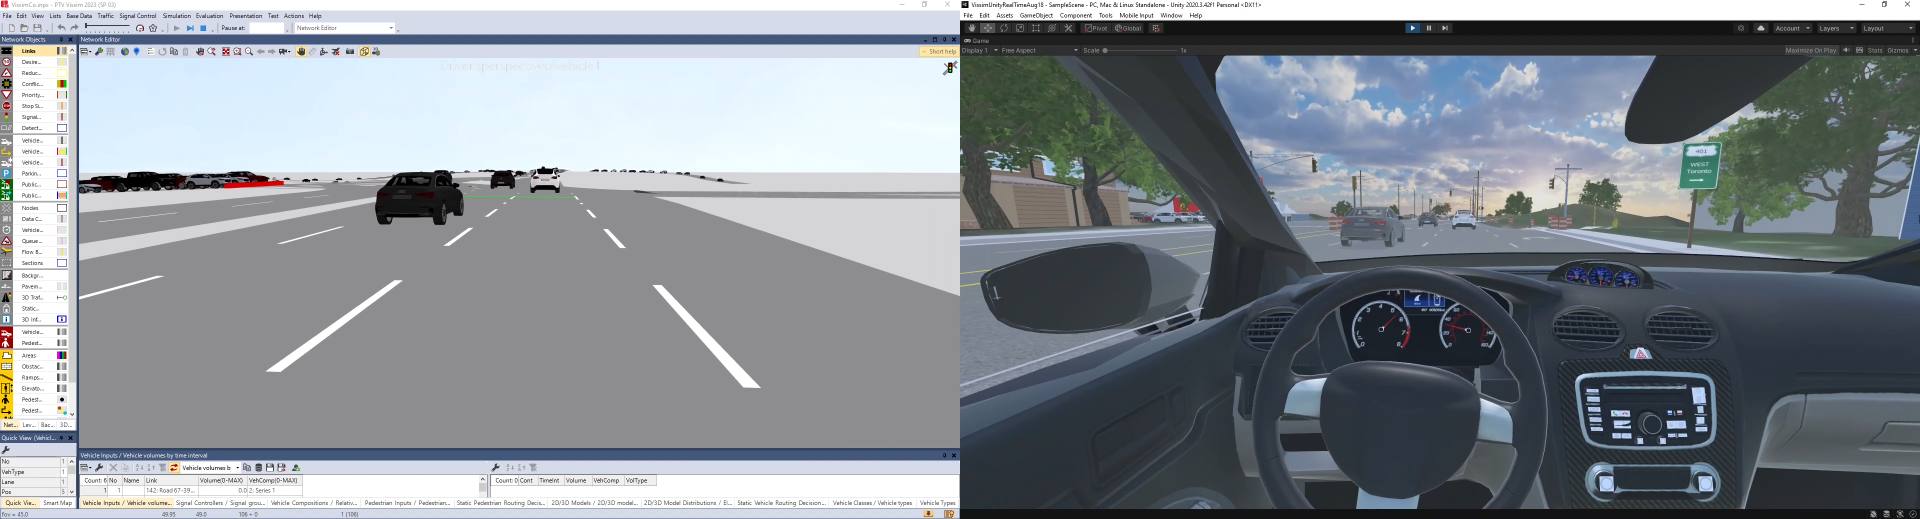
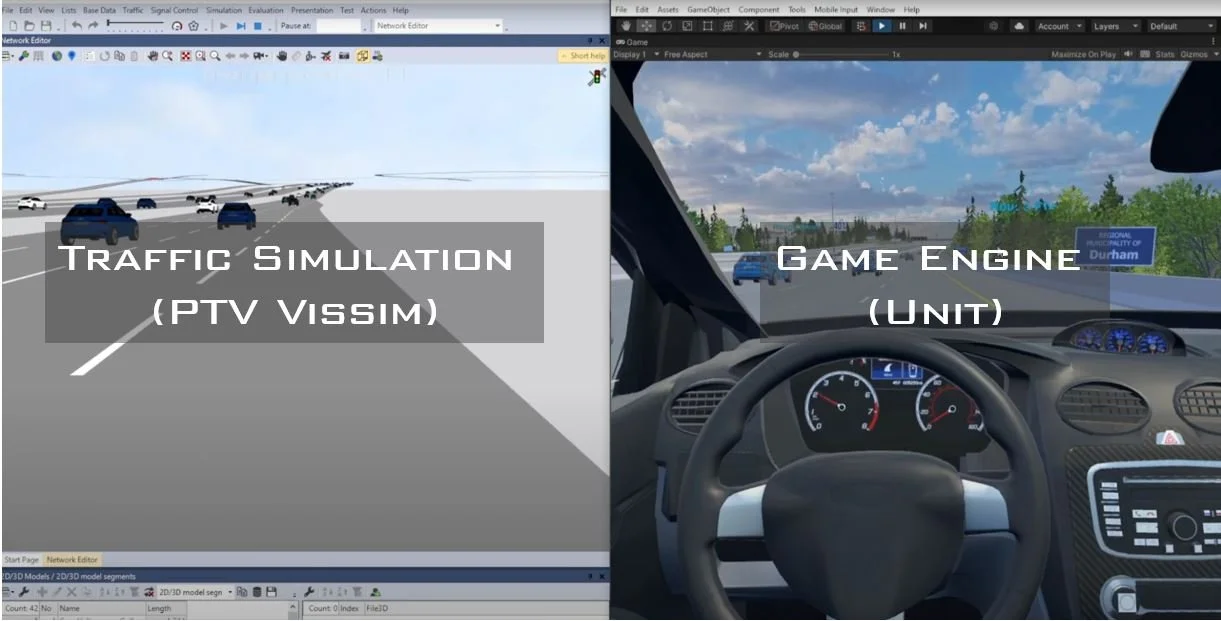
Co-Simulation of Vissim and Unity
Integration of Vissim and Unity game engine (known as Co-Simulation) represents exchanging the data including trajectory coordinates (X, Y, Z) of cars/trucks in a fraction of a second (0.05 sec). This allows to develop a driving simulator where a human wears a Virtual Reality (VR) headset and through physical steering wheel and pedals controls a car/truck in Unity where all other traffic movements are coming from Vissim. This approach provides a more accurate representation of driver behavior by mimicking real-world situations in a controlled environment. The simulator can allow researchers to invite several users and receive quantitative (measure travel time and traffic conflict) or qualitative (survey) feedback. Our video showcases the Integration of Vissim and Unity as part of our project to evaluate the impact of intelligent lane utilization in HWY 401 in Municipality of Durham, Ontario
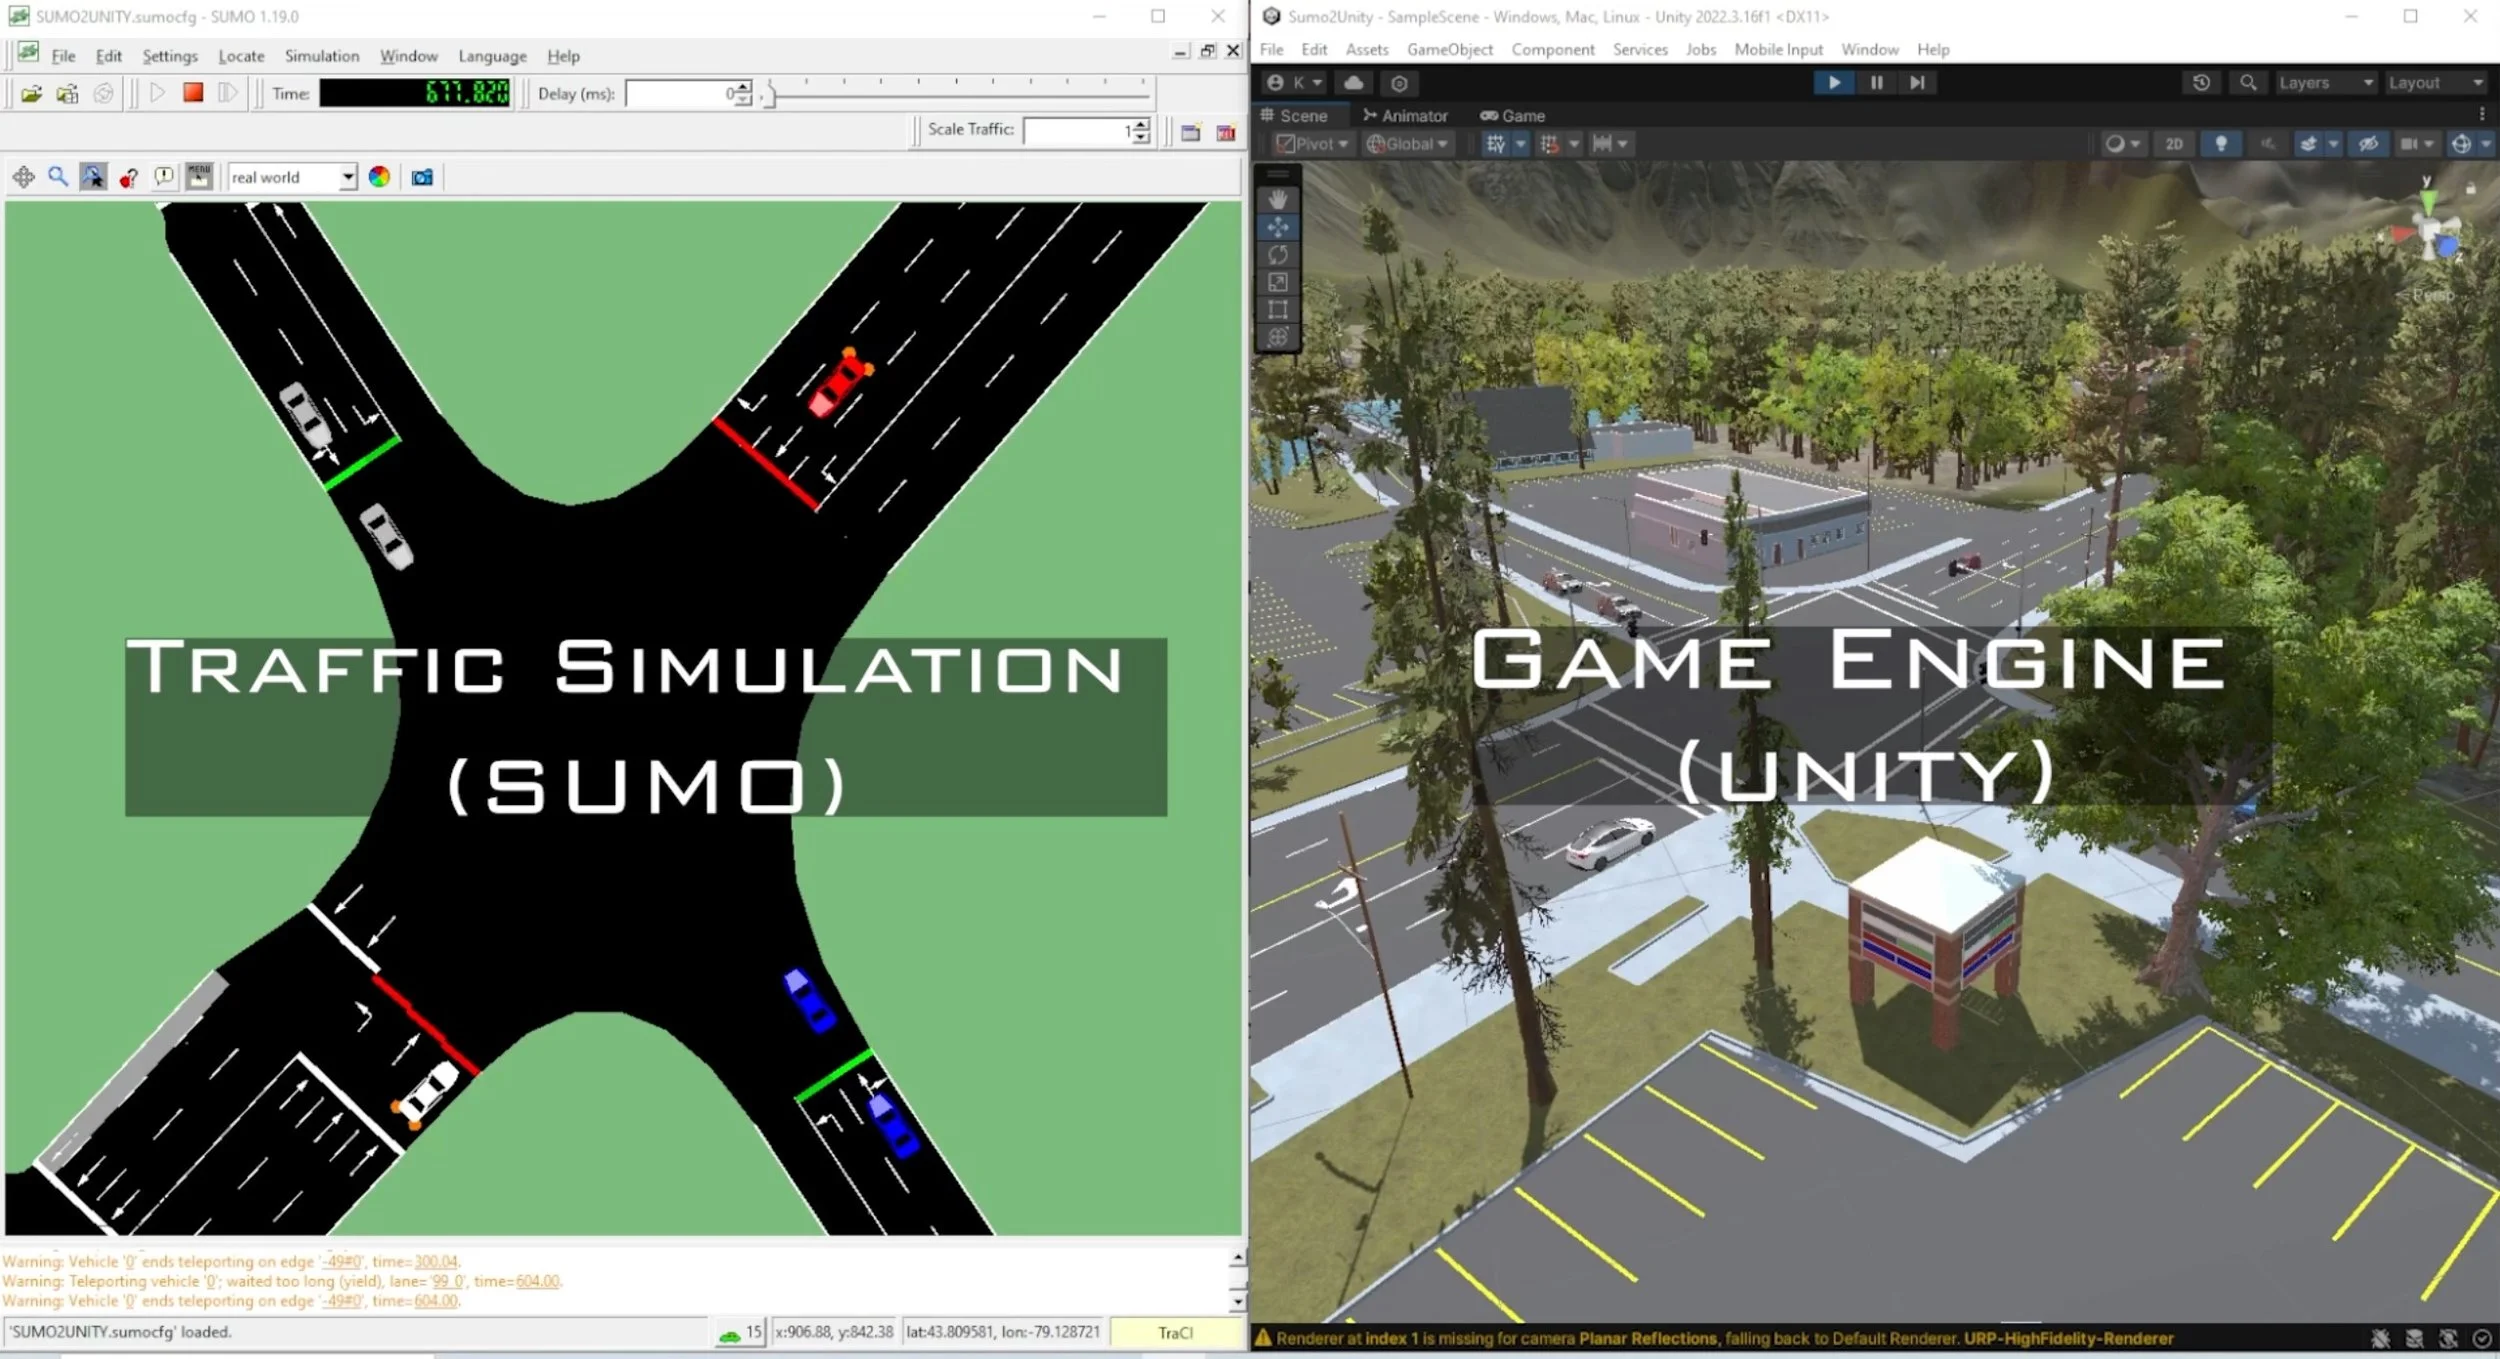
Co-Simulation of SUMO and Unity
While Vissim is mainly used by transportation planners for conducing traffic analysis; Simulation of Urban Mobility (SUMO) is used by automotive industry to test vehicular technology (V2V or V2I technologies). We observed that researchers invested considerable time, effort, and money in developing a co-simulation tool that integrated SUMO and Unity. Each study ‘re-invented the wheel’ and therefore sacrificed resources that could have been used to focus on the ultimate goal, i.e., improving traffic flow/safety. We developed Sumo2Unity, an open-source co-simulation tool helping other researchers. The tool includes: 1. the integration of SUMO and Unity (programming), 2. A 3D environment including 3D models of vehicles, traffic lights, and various road configurations, 3. a realistic interior design of a simulator vehicle and vehicle dynamics.
3D Interactive User Interface
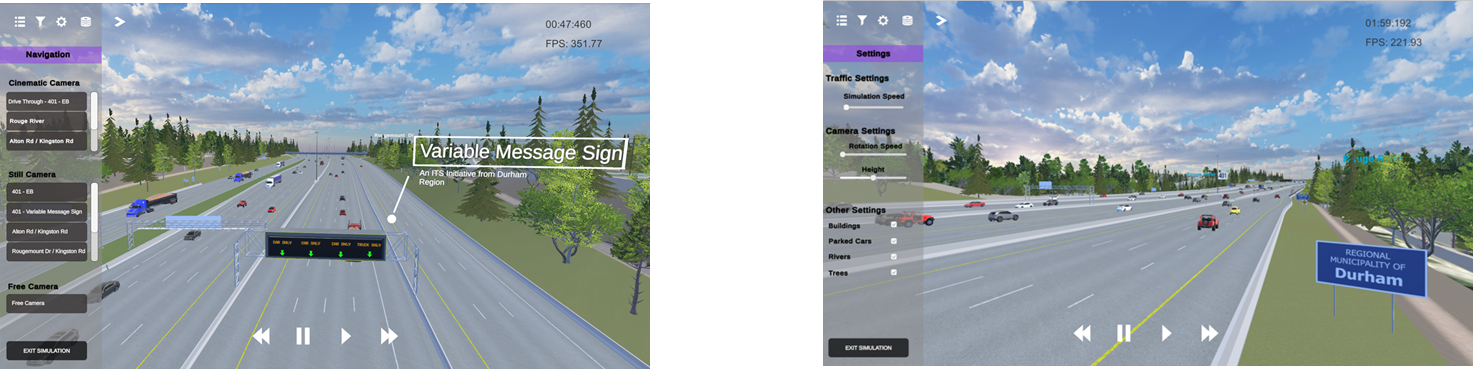
Visualization Interface
Keeping stakeholders informed throughout a project has become critical during transportation projects. Stakeholders are groups or individuals who are interested and potentially affected by the outcome of a transportation decision. This group includes government agencies, city planners, general public, environmental and advocacy groups, and community and local business owners. It is important to analyze the interests, concerns, and influence of all stakeholders in detail so that we can manage relationships effectively. Our video showcases a 3D visualization interface that greatly aids stakeholders in comprehending the technical and general aspects of truck friendly measures.

Active Transportation and MicroMobility
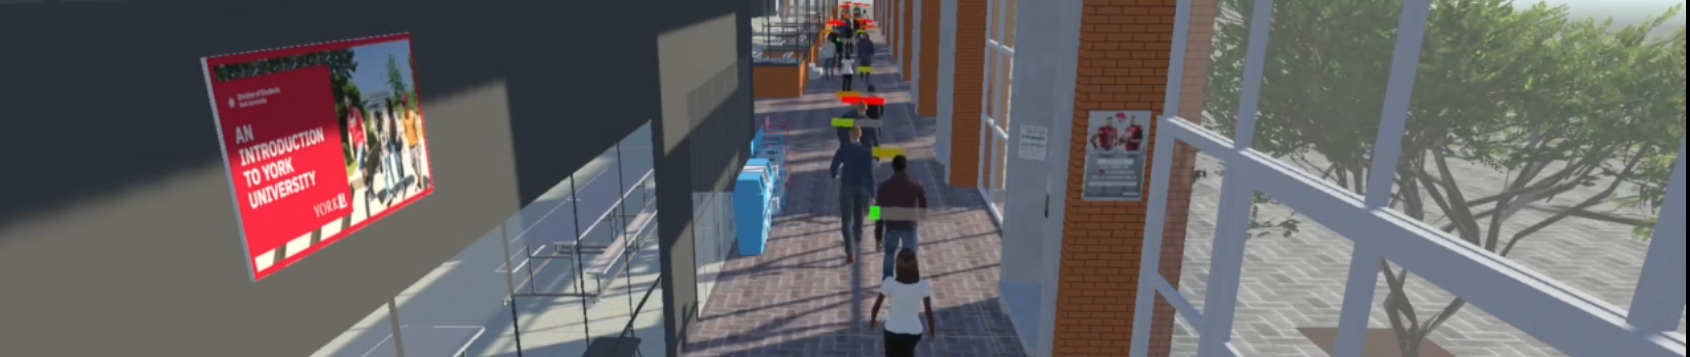
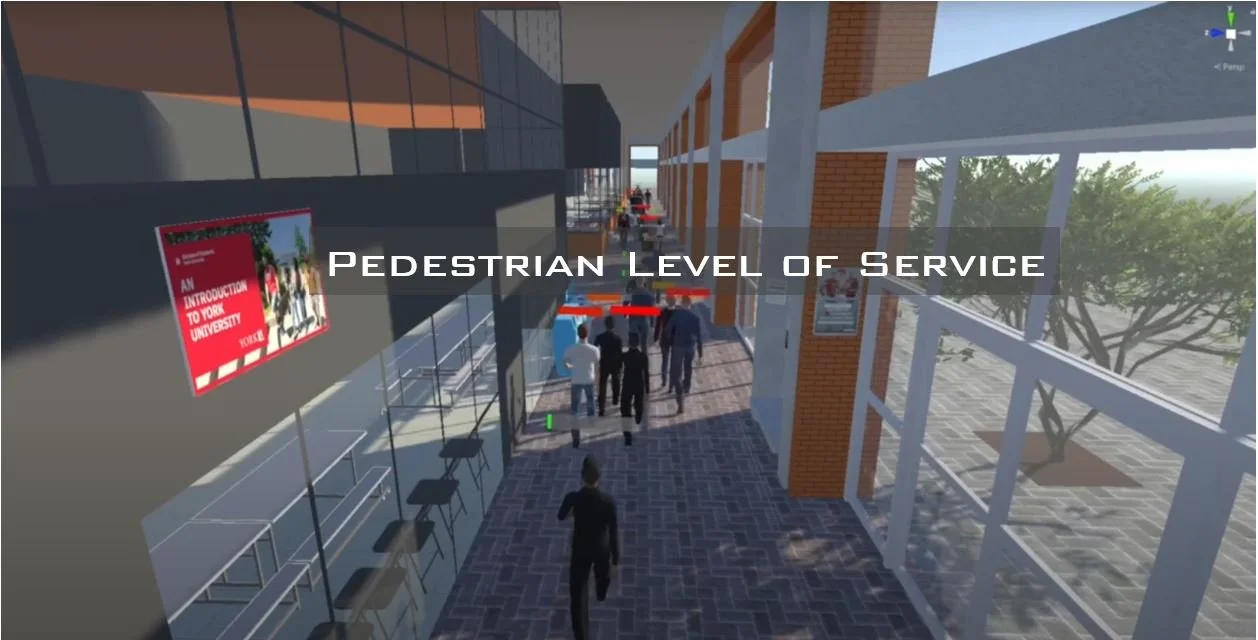
Enhancing Pedestrian Level of Service
The problem lies in the current method for analyzing pedestrian facilities, which relies on density as a quantitative indicator to assess Pedestrian Level of Service (PLOS). Density fails to capture restricted movement, such as shoulder brushing or bumping into others, which are critical for understanding pedestrian navigation. Addressing restricted movement is essential for effective mobility interventions, such as removing obstacles or widening sidewalks. We developed an enhanced PLOS integrating density and restricted movement using an intelligent vision system in Unity. The system, tested at York Lane, York University, operates in three phases: detection, PLOS analysis, and countermeasure selection. Using Vissim for realistic pedestrian simulations, we evaluated four scenarios involving static and dynamic objects.

Freight Transportation
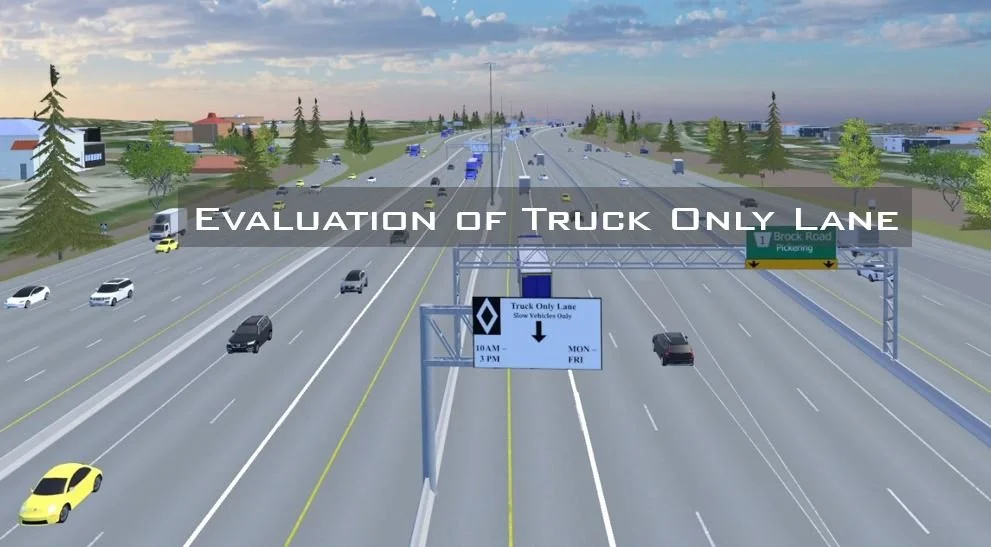
Evaluation of Truck Only Lanes
The congestion problem along HWY 401 in Ontario, Canada is identified as a key problem by Municipality of Durham in Freight Forum in 2022. The target study corridor identified by Municipality spans 62 km length with 26 interchanges on the Highway. We used PTV Vissim to evaluate several scenarios such as do-nothing scenario, implementing truck only lane. We also developed a 3D visualization tool by integrating PTV Vissim and Unity Game Engine that greatly aids stakeholders in comprehending the technical and general aspects of project.

Intelligent Transportation Systems
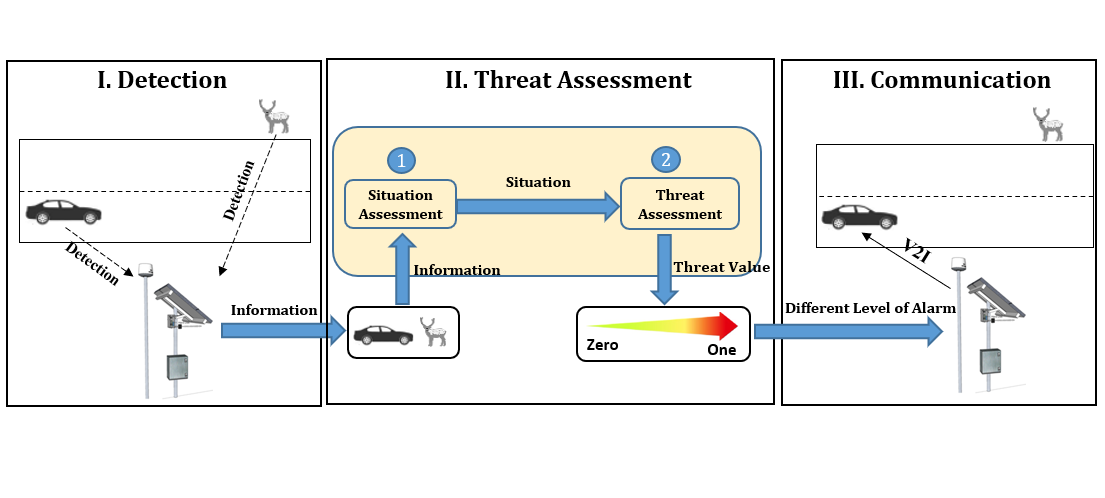
Enhanced Roadside Animal Detection System
Collisions involving large animals are a serious safety, economic and ecological concern. Some North American jurisdictions have installed a roadside animal detection system (RADS) that can warn the possible presence of large animals on rural highway sections. This study provides a conceptual framework for developing an enhanced RADS by proposing a threat analysis algorithm that integrates four input indicators (e.g., physical distance between animal and vehicle). The methodology was tested using real-world traffic and animal data collected from a conventional RADS in British Columbia, Canada. The enhanced RADS can disseminate varying levels of warning according to the estimated level of the threat rather than the constant level of warning generated by a conventional RADS. The enhanced RADS can also use a Vehicle-to-Infrastructure communication technology to establish direct wireless communication with vehicles at risk, for instance, to automatically control a vehicle’s speed to avoid a collision with a large animal.

Protect Police Officers from Roadside Collisions
Police officers on duty on the road for traffic stops, vehicle collisions, traffic direction, etc. are exposed to the risk of being hit or even killed by a passing vehicle. This study proposes an Internet-of-Things (IoT) protection system for police officers on duty on the road. The development of the system envisaged involves three essential phases: 1) detection, 2) risk analysis, and 3) warning and communication. This study has focused on the risk analysis phase. We applied an AI algorithm that integrates four input indicators (lateral distance from police officer to traveled lane, magnitude of speeding, stopping sight distance, and direct distance) into a single estimate of the risk of a collision. The study used data from a real-world situation on Highway 416 in Ontario, Canada to demonstrate the application of the proposed model. The results clearly demonstrate that the proposed model can be used to generate risk estimates that could be used to give timely warning of a possible collision risk to police officers at work on a road.

Public Health
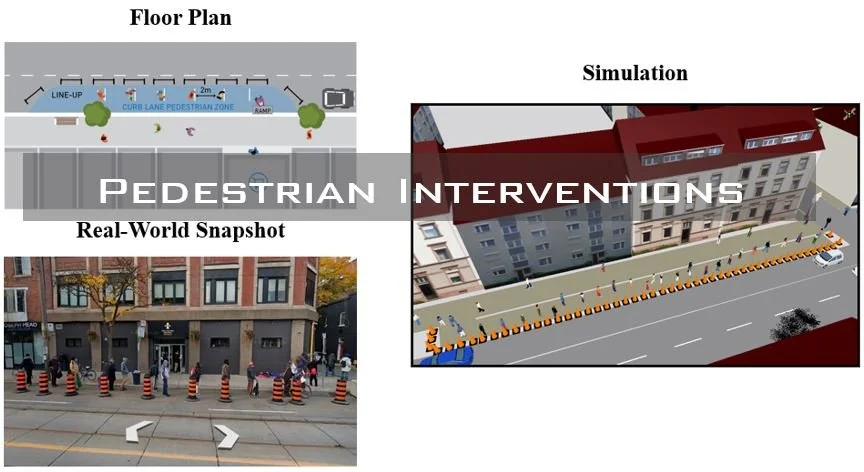
Evaluation of Pedestrian Mobility Interventions during a Pandemic
Cities worldwide rapidly introduced various mobility interventions—such as sidewalk extensions and outdoor dining areas—to help people maintain physical distancing while accessing essential services. Despite these efforts, limited quantitative research exists on how these interventions affect distancing.
In response, this study used a simulation environment (PTV VisWalk) to model two corridors in Toronto under four scenarios: with/without sidewalk expansion for patio and with/without curb lane pedestrian zones. The results revealed that while curb lane pedestrian zones significantly improved physical distancing, sidewalk expansions for patios actually reduced it. These findings underscore the importance of using quantitative measures of effectiveness to evaluate mobility interventions and guide decision-making for safer street designs.
Mobility Intervention: Curb Lane Pedestrian Zone
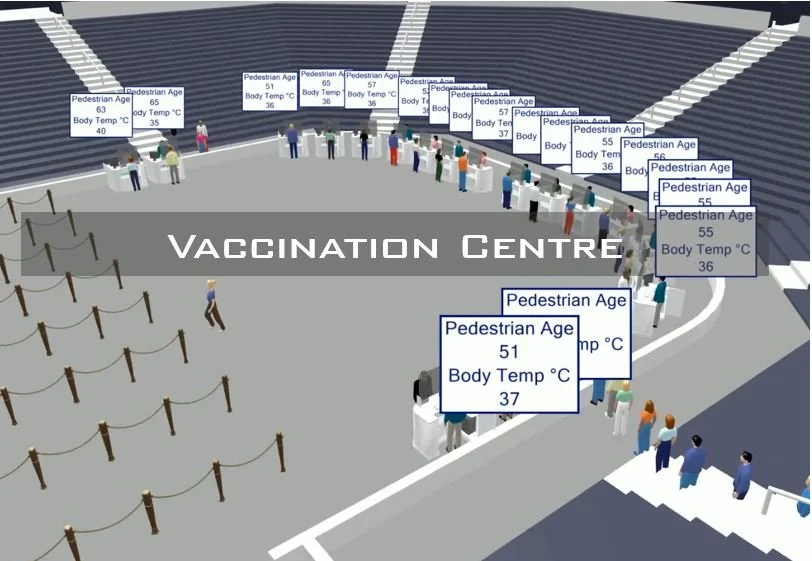
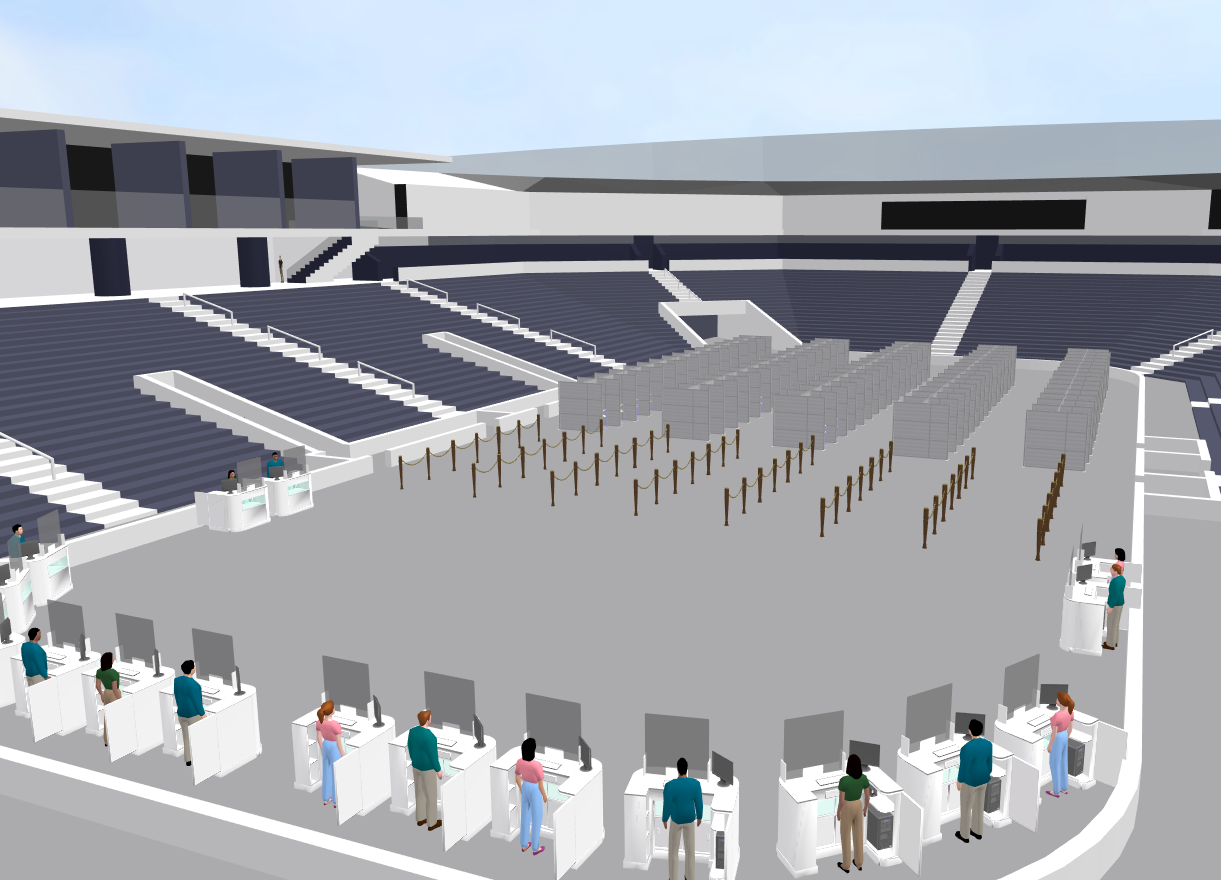
Improving Capacity of Vaccination Centre During a Pandemic
We used PTV Viswalk to build a microscopic pedestrian model of Toronto’s mass‑vaccination centre, navigating patients through Entrance, Pre‑screening, Registration, Vaccination, Aftercare and Check‑out. Pedestrians are colour‑coded (grey, yellow, red) to flag two‑metre distancing violations, allowing capacity tests under varying arrival volumes. Increasing demand reveals how often physical distancing breaks down and how wait and service times escalate, enabling planners to define a safe maximum occupancy and determine the minimum staff mix that prevents excessive queuing. Results demonstrate that simulation can quickly estimate centre capacity, waiting times and service duration while maintaining public health guidelines.